SoC Efficiency: What chips are the most efficient?
Benchmarks tell you how fast a phone is. They don’t tell you how much energy that performance costs. Our SoC Efficiency metric does though. It answers a single question: how much GPU work does a chip produce per watt of power?
The data so far shows a wide gap between Apple and everyone else, a small generational gain in Qualcomm’s flagship line, and a potential regression in Google’s Tensor.
How the metric works
SoC Efficiency is reported in frames per second per watt — effective sustained fps divided by SoC power. Effective frames per second comes from the 3DMark Wild Life Extreme stress test: peak frame rate multiplied by stability percentage, which equals the average frame rate sustained across the full twenty-loop run. Stability matters because a chip that boosts to 60 fps and crashes to 20 isn’t really delivering 60.
Total power during the stress test comes from battery drain over the test window. The display’s contribution is calculated separately and subtracted out. We measure display power using the difference between two video playback tests (one at maximum brightness, one at 200 nits) which produces a nits-per-watt curve for the panel. The Wild Life Extreme stress test also runs at 200 nits, the same reference point as the display test. That alignment is deliberate. When we subtract the display’s 200-nit power draw from total power during gaming, the display contribution drops out cleanly. What’s left is the chip and its supporting silicon, running under graphics load.
Top 10 by SoC Efficiency
The measurement isn’t perfectly clean. Tests run on airplane mode with background sync disabled, but a few system processes will always be active. In practice the noise is small relative to the differences between chips.
A score of 10 fps/W means the chip sustains 10 frames per second of GPU output for every watt of SoC power.
Apple is in a different league
The A-series sweeps the top of the leaderboard. Every iPhone in the dataset ranks ahead of every non-iPhone for SoC efficiency. The A19, A19 Pro, and A18 take the top three chip positions, and Apple’s least-efficient phone in our database (the iPhone 17 Pro Max at 7.10 fps/W) still beats every non-iPhone we’ve measured.
Average SoC Efficiency by chip brand
Flagships ($700+) released in the past 18 months
The most efficient device is the iPhone 17e at 10.30 fps/W. That’s about 16% above the next-best iPhone (the 17 Pro at 8.90 fps/W) and roughly 65% above the best non-Apple phones, the Galaxy S26 Ultra and Honor Magic7 Pro, which tie at 6.20 fps/W.
This matches Apple’s longer-running silicon advantage. The A-series is designed in-house, fabricated on leading-edge TSMC processes, and tuned together with iOS and Metal. The result is more graphics work per joule than any other vendor in the database produces.
Has Tensor gone the wrong way?
Google’s Tensor G5 produces lower SoC Efficiency than the Tensor G4. To be clear, the G4 sample is two A-series budget phones (Pixel 9a and Pixel 10a), while the G5 sample is four flagships (Pixel 10, 10 Pro, 10 Pro XL, 10 Pro Fold). That’s not a clean generational comparison. The budget may not push their limits, as much as the flagship tiers. The flagships run hotter and denser, with sustained workloads. The gap reflects thermal envelope alongside silicon.
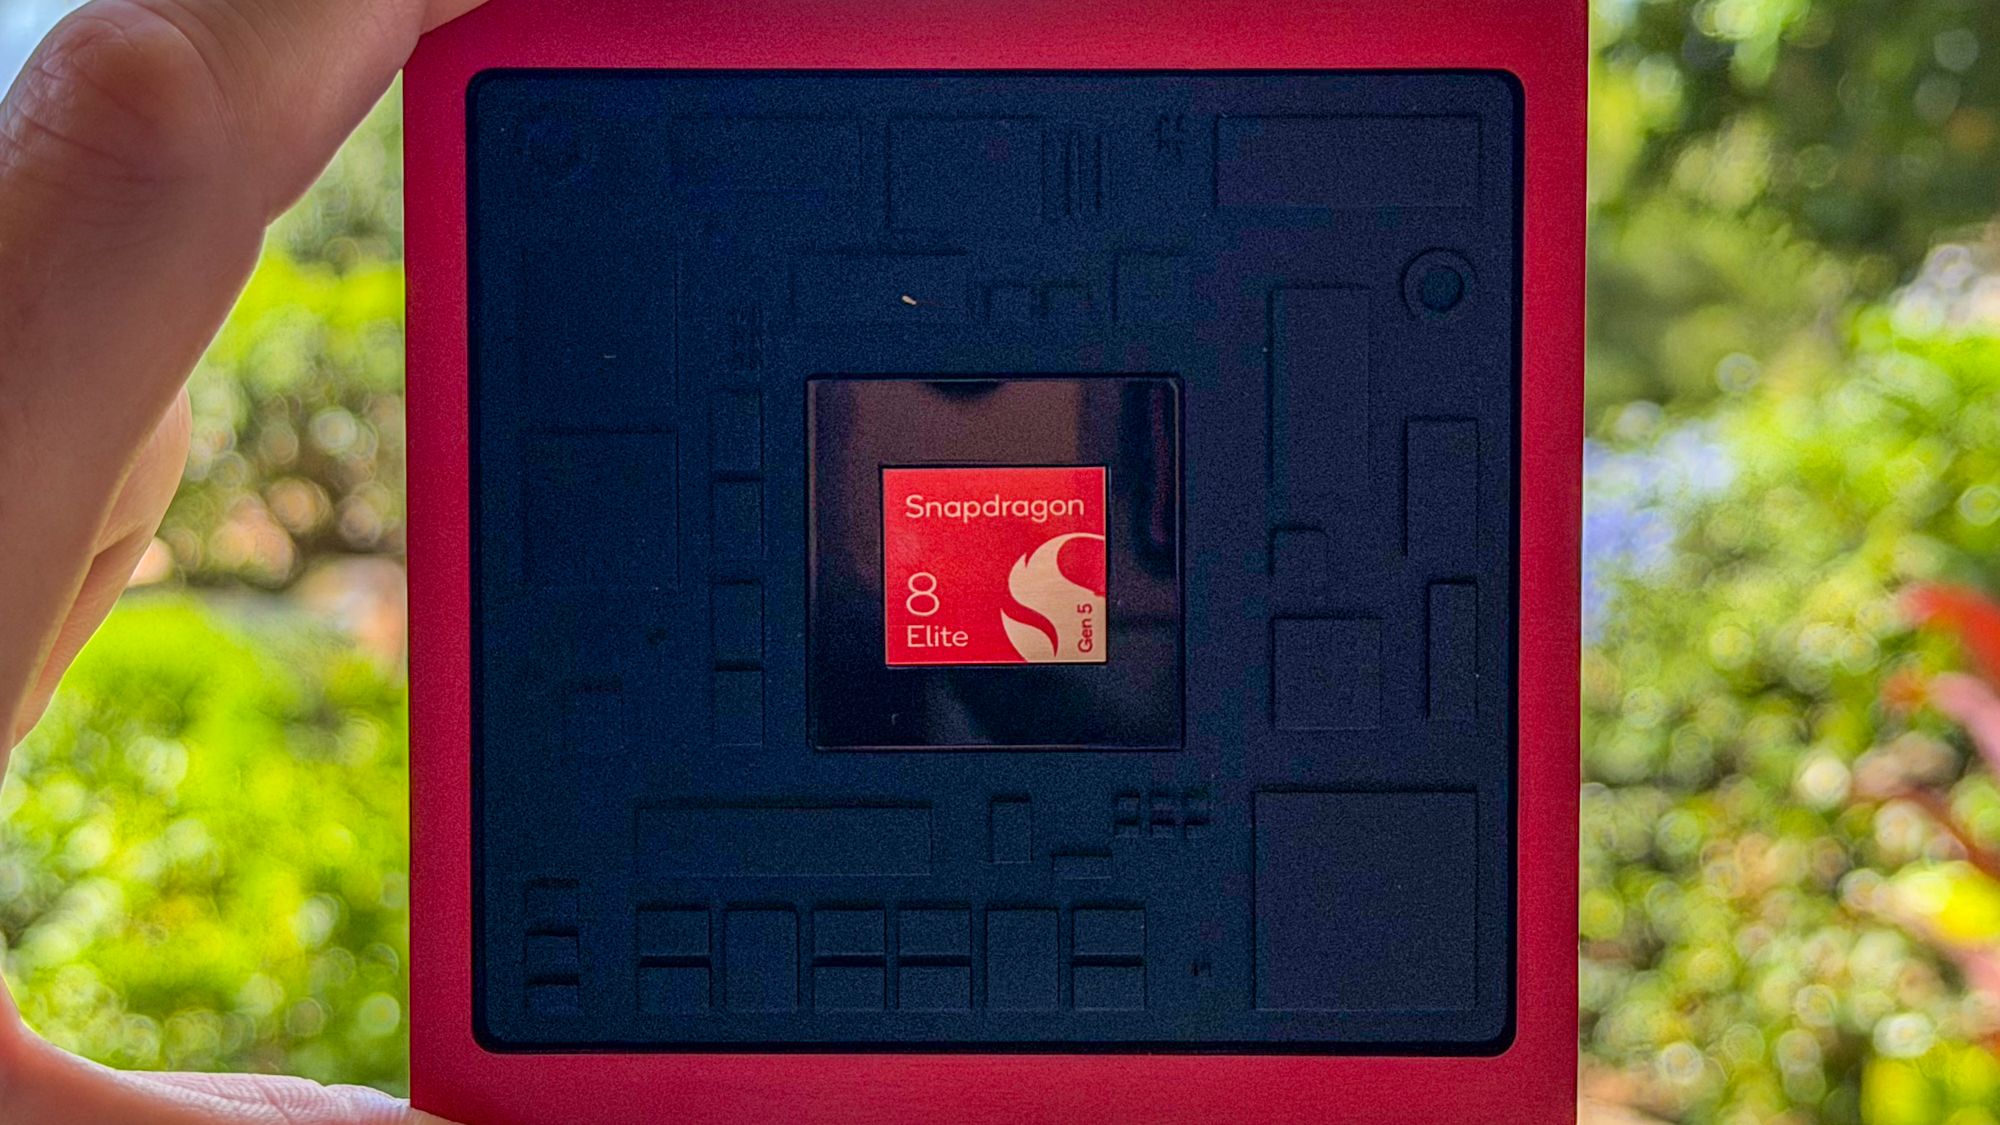
Even setting that aside, the absolute numbers aren’t flattering. The four Tensor G5 Pixels cluster between 3.30 and 3.50 fps/W. Compared to Snapdragon 8 Elite Gen 5 competitors at similar price points, the gap is large. A Pixel 10 Pro XL at 3.50 fps/W produces a little over half the fps/W of a Galaxy S26+ at 6.10 fps/W during the same stress test.
Tensor’s design priorities have always been weighted toward on-device machine learning rather than peak GPU efficiency, and Google has been candid about that trade-off. The data quantifies it. A Pixel 10 sustaining 13.7 effective frames per second at 4,111 mW of SoC power isn’t doing badly in absolute terms — it’s doing badly relative to what flagship competitors achieve at similar power budgets.
Chip family isn’t everything
Not all phones with the same chip act exactly the same. The OEM decides where in a band the phone actually lands.
SoC Efficiency by chip family
Each dot is a phone.
These bands separate pretty cleanly. Apple's A-series sits well above everything else — every iPhone we've tested beats every non-iPhone, and the gap between A18, A19, and A19 Pro is small compared to the gap between Apple and the next-best chip family. Snapdragon 8 Elite Gen 5 phones cluster around 5.5 fps/W. Tensor G5 sits between 3.30 and 3.50. Mid-range Snapdragon 7 and MediaTek Dimensity chips fall below that. So if you know the chipset, you generally know where the phone migh land.
What's harder to pin down is how much OEM execution actually moves things within a band. The clearest within-band picture comes from the Snapdragon 8 Elite, which is the most-tested chip we've looked at. There are eleven phones with the Snapdragon 8 Elite, with a 63% spread from the Honor Magic7 Pro at 6.20 fps/W down to the Xiaomi 15 Ultra at 3.80.
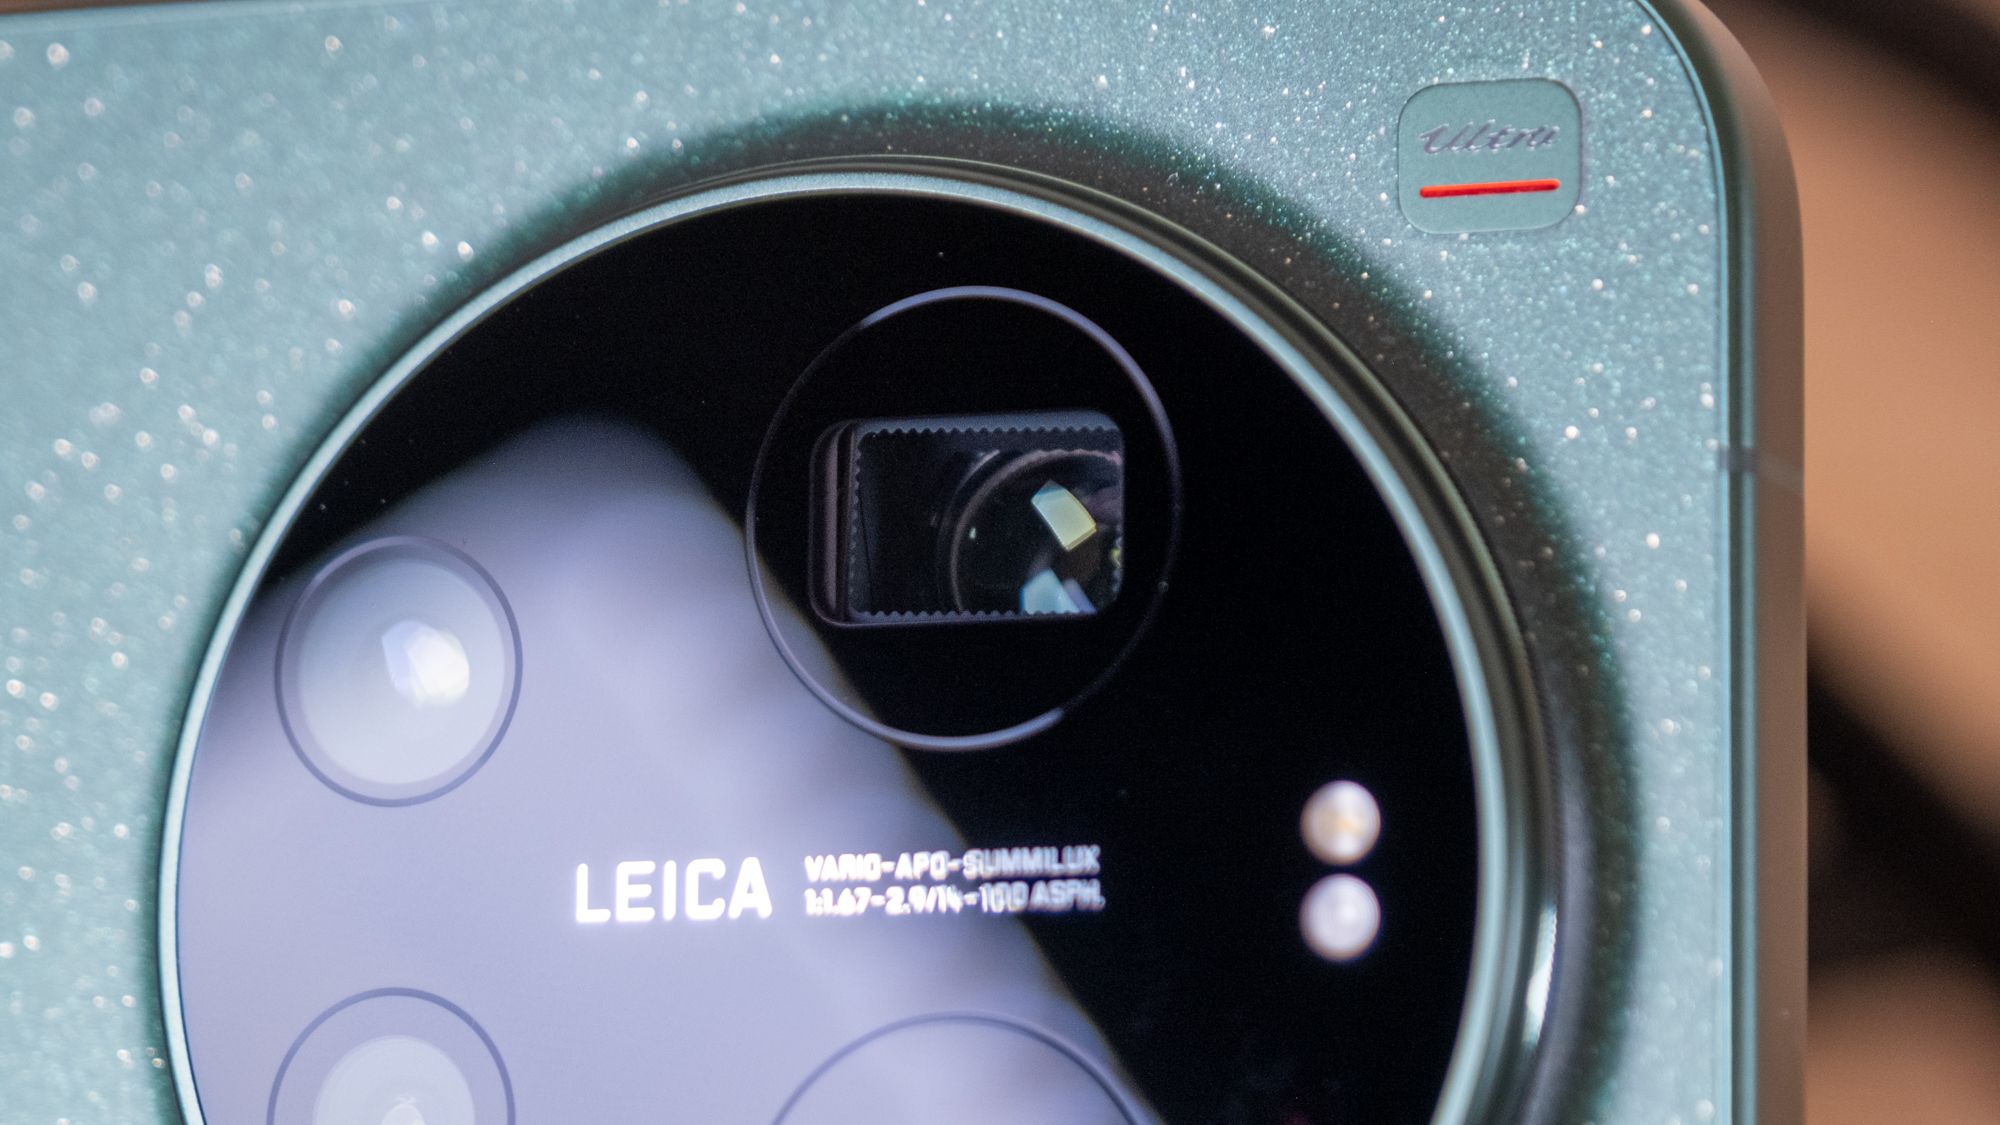
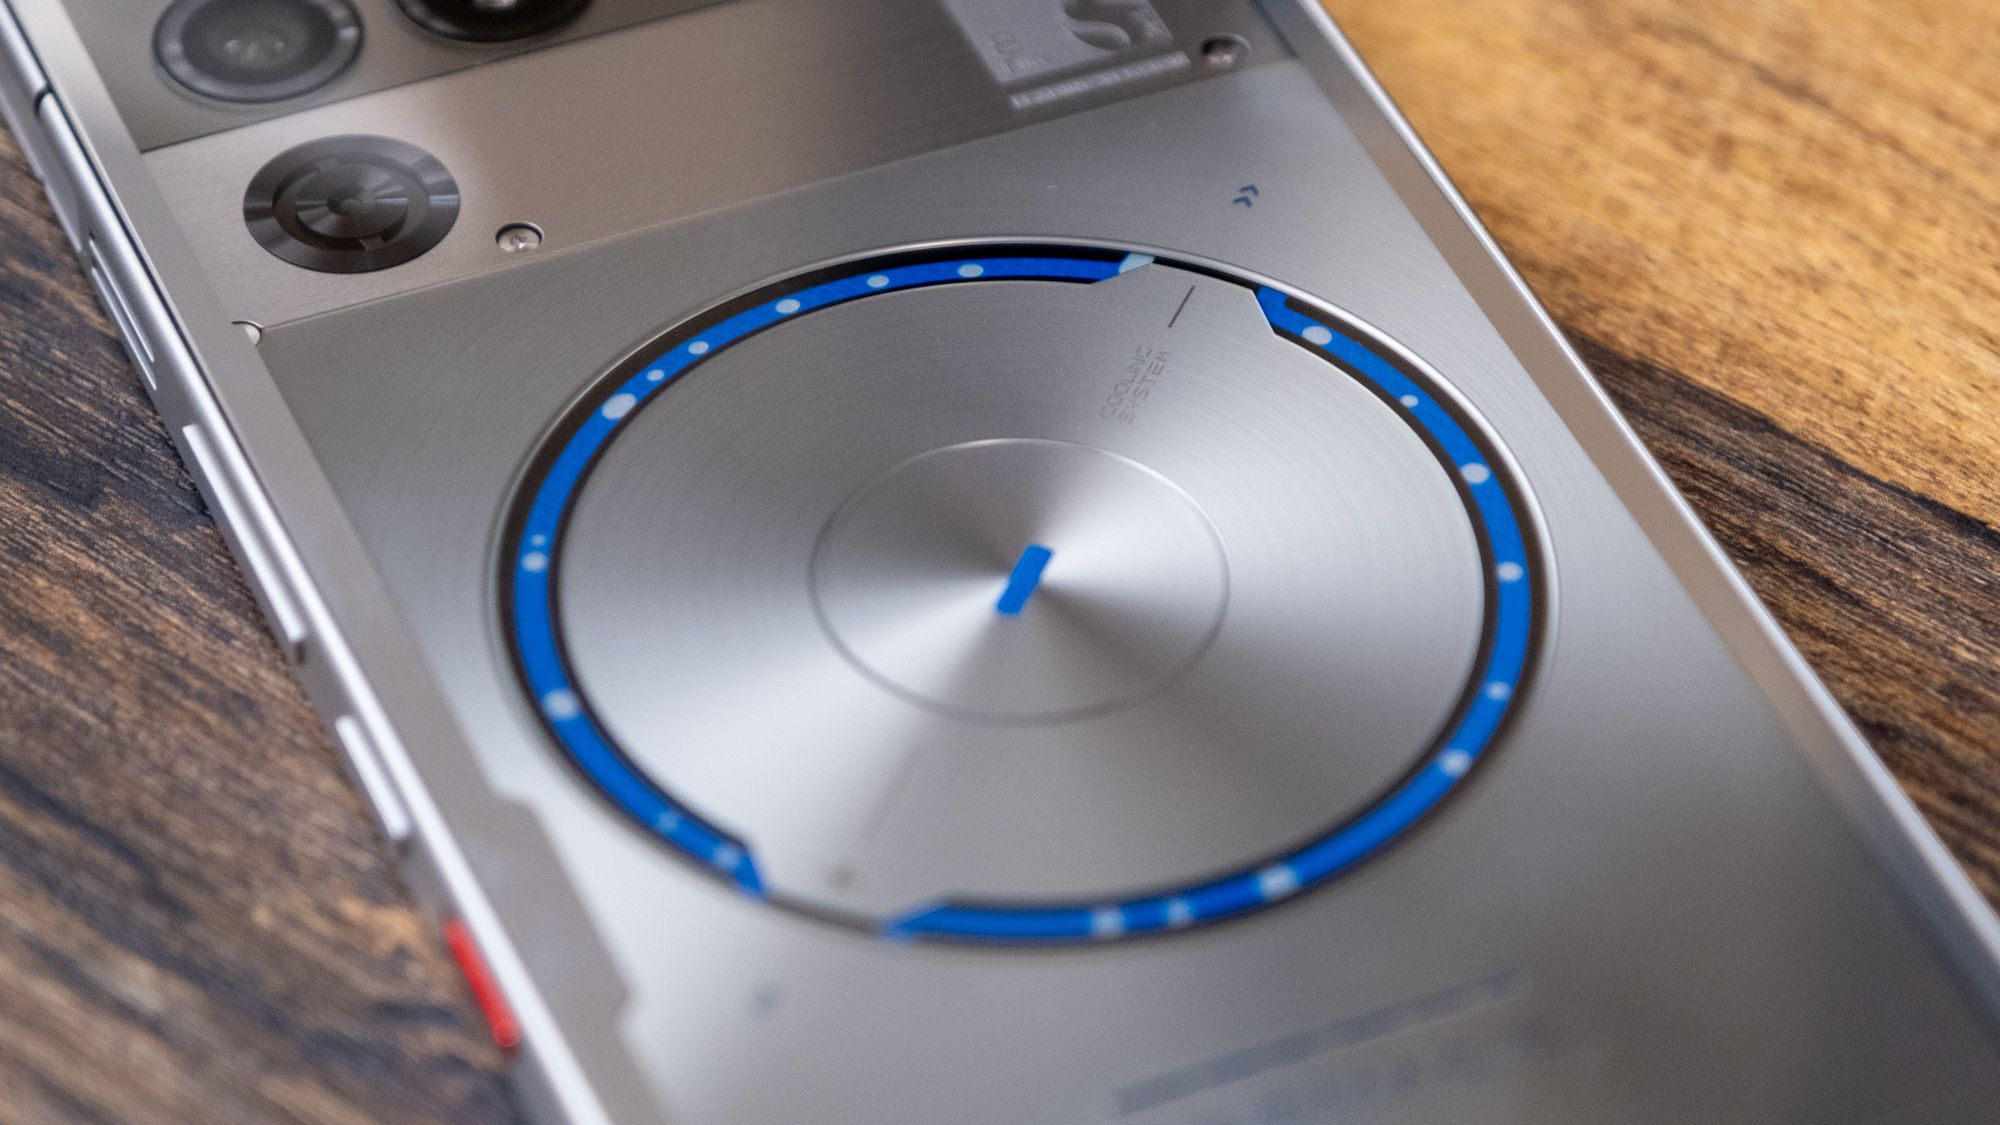
Gaming phones, foldables, very thin flagships, and phones with oversized camera modules all push past what the chip can sustain efficiently — and the SoC Efficiency metric reflects that.
The Honor split
SoC Efficiency vs Display Efficiency
Each dot is a phone.
Honor’s lineup illustrates that SoC Efficiency and Display Efficiency are independent engineering decisions. The Magic V5, which is Honor’s flagship foldable for 2025, runs a Snapdragon 8 Elite and produces respectable SoC efficiency at 5.60 fps/W. Its inner display, however, is one of the least efficient panels in the database at 1.10 nits/mW. The Magic8 Pro shows a similar split, at 5.10 fps/W for the chip, and 2.30 nits/mW for the panel.
Then there's the Honor 600, which sits at the opposite extreme. It runs a mid-range Snapdragon 7 Gen 4 and produces just 3.10 fps/W on the chip side. But its panel hits 20.20 nits/mW, which is among the most efficient displays we've measured.
Basically, an efficient chip and an efficient panel are two different engineering investments, sourced from two different supply chains, and brands rarely land both. The phones that lead in one dimension (Apple’s iPhones for chip, Samsung’s S25+ for panel) are narrow specializations rather than integrated efficiency programs.
Conclusions
Raw components don't dictate everything about a phone. An OEM still has to decide how to tune the chip, what body to put it in, how the cooling is laid out, how much power the display burns, and how aggressive the performance ceiling should be. The SoC sets a starting point. The rest of the phone decides whether the chip runs efficiently or has to do more than its envelope rewards.
The data we have so far makes that pretty clear. The same Snapdragon 8 Elite produces 6.20 fps/W in the Honor Magic7 Pro and 3.80 in the Xiaomi 15 Ultra. The same Tensor G5 produces nearly identical numbers across four Pixels — because Google makes them all.
So if you're cross-shopping by spec sheet, the chip name may tell you roughly how well the phone performs — but there’s a whole lot of variation that can come from everything else about a device’s construction.
Related
Sensor size vs dynamic range: Does a bigger sensor capture more?

Megapixels vs sharpness: Does resolution buy sharper photos?

Display efficiency: Which phone displays do the most with the least?

Motorola Razr+ (2026) vs Samsung Galaxy Z Flip 7
How we test charging
How we test performance
Samsung Galaxy S26 Series vs Google Pixel 10 Series

Motorola Razr (2026) vs Motorola Razr+ (2026)
Apple iPhone 17 Series vs Google Pixel 10 Series

Motorola Razr (2026) vs Motorola Razr Ultra (2026)

Honor Magic V6 vs Honor Magic V5

How we test batteries